


1. Overview |
|
|
 Back to Top
MailFlow Analyzer provides a Report module creating Word or Excel files.It gives access, through a Word or Excel file, to a summary of the statistics usually available in the Mail Flow Server and Mail Flow User databases. The choice of Word and Excel as file format allow the printing of the document without loss of quality and make easy its diffusion by mail.
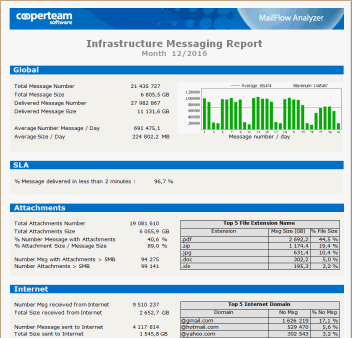
Word based Report
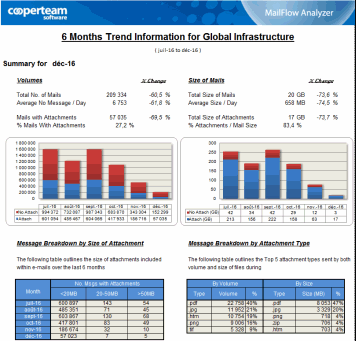
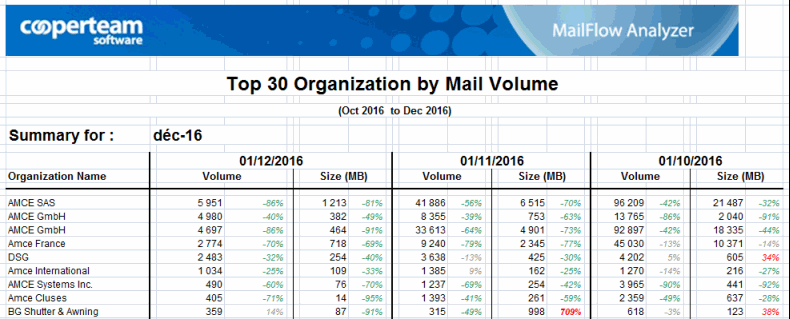
Excel based Report
The creation of these reports can be done on demand or automatically scheduled (on a daily, weekly, monthly or yearly basis) and their diffusion can be done by sending the report document by mail or publishing the report document in a third-party Notes database. You can access the Mail Flow Analyzer Report module by opening the Mail Flow Report database from your workspace:

or using the Search entry from the main navigator of the Mail Flow database:
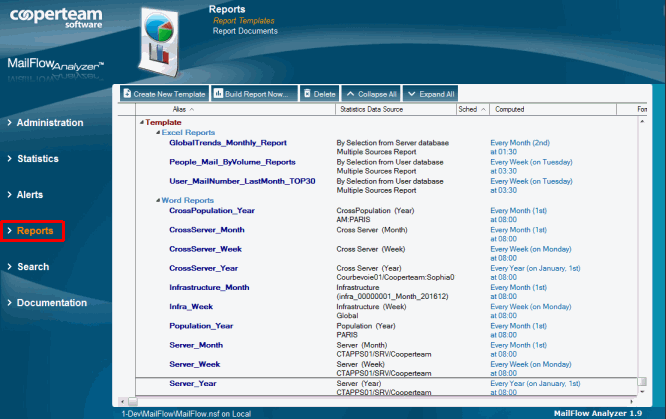
Customizing Reports provided with the application or creation of new reports is done by manipulating Report Template documents located in the Reports / Report Templates view of the Mail Flow Report database.
2. Creating a Report Template |
|
|
Creating a Report Template allows you to specify a set of information to be displayed in a report (Word or Excel). Application Dashboard embeds sample reports allowing you to understand the operation and capabilities of Reporting. To create your own report, click the button  available in the Reports / Report Templates view in Mail Flow Report database.
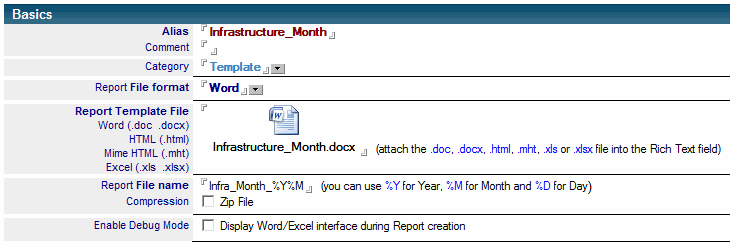
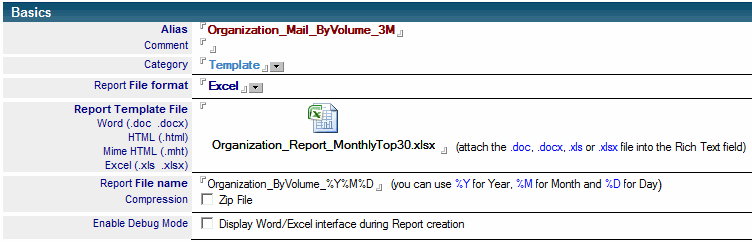
The header of the Report Template document contains essential information used to build the report such as the name of the report template (Alias). The comment field (Comment) and the category field (Category) can help to define the purpose of the report and its classification in the view:
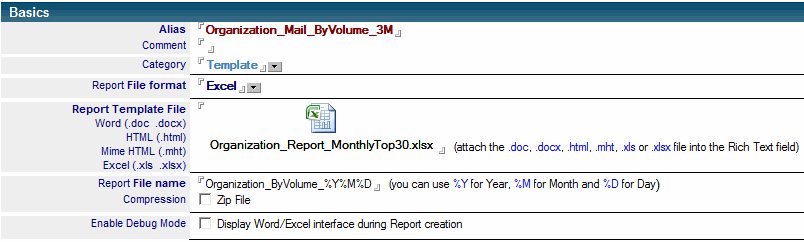
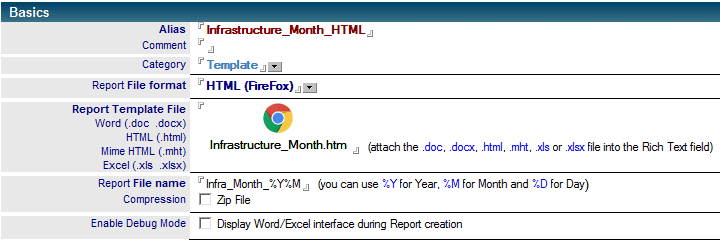
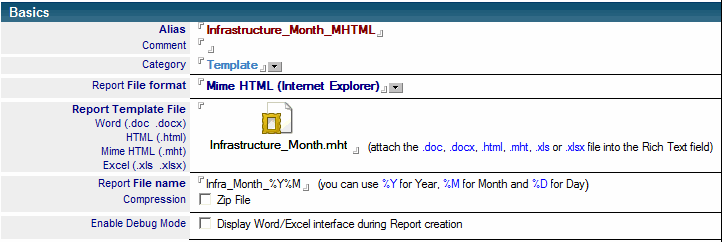
The Report File Format field defines the type of file used (Word, Excel or HTML). It must be exactly the same as the file extension attached in the Report Template File field.
The Report Template File field contains the attached template file (Word, Excel or HTML), without the data. When the report is generated, the file is filled with all the requested information (texts, numbers, tables, graphics...)
The Report File Name field contains the name of the final report file. You can generate dynamic file name by using keywords based on current date / time : %Y (current year) %M (current month) and %D (current day). For example, the file named Organization_ByVolume_%Y%M%D will become the Organization_ByVolume_20150419.xlsx if the report is an Excel file generated on April 19th, 2015.
If the option Compression is checked,the generated report will be zipped before being attached to the result document. With Word and Excel files using the .docx or .xlsx extensions, the Zip compression is now useless. It remains relevant for older versions of the files (.doc and .xls).
The Enable Debug Mode option lets you display the Excel or Word interface during the creation of the report. This is useful to see any error messages displayed during the report creation. The usage of this option should be restricted to trouble shooting sessions, in case of errors during the creation of the report.
A Report Template document contains six tabs: Data Origin, Scheduling, Delivery Options, Appearance, @Formula Repository and Actions List, as shown below. Each tab is explained above (click each Tab for details):
Data Origin
The Data Origin tab lets you select the statistics documents coming from Mail Flow Server or Mail Flow User database where the data used for the report are taken from. The Word reports use most of the time data coming from 1 or 2 statistics document (such as Infrastructure documents) while Excel reports may use data from thousands of statistics documents (documents User).
For Word Templates, it is individual references to documents :
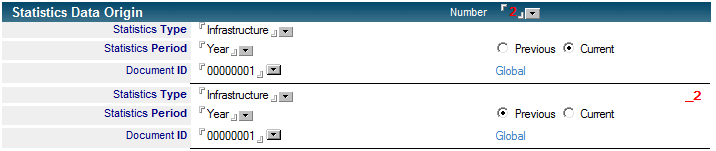
The radio button Previous / Current lets you adapt the period of the statistics document based on the creation date of report. In the previous example, the first bloc refers to the Infrastructure statistics document for current year (Current)and the second bloc refers to the Infrastructure statistics document of the previous year (Previous).
The red suffix located at the right of the block (_2 for block #2) are used to indicate, in the Word Template file, from which statistics documents come the fields. In the following Template, the Tag [Total_Nb] refers to field Total_Nb from the first document (Infrastructure Year Current) while the tag [Total_Nb_2] refers to field Total_Nb from the second document (Infrastructure Year Previous):

There are two suffixes defined by default covering two periods of time linked to the first statistics document declared in the table:
_1 : Indicate the previous period (for a year, it will be the previous year, if it is a month, it will be the next month...)
_0 : Indicate the inclusive period (for a day, the inclusive period is the week including this day, if it i a month, the inclusive period is the year containing this month...)
For Excel Templates, we use @Formula to select documents:

Scheduling
The Scheduling tabs displays options used for scheduling the report creation:
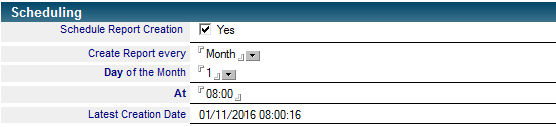
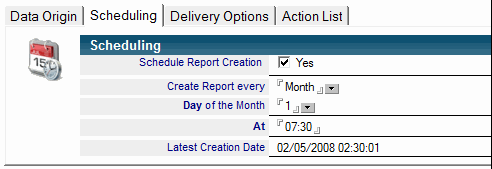
If the option Schedule Report Creation is selected, the report will be automatically generated on the Domino server hosting Mail Flow engine. You need to specify the expected period (Day, Week, Month or Year), the Date and the Hour.
In order to have the Word or Excel reports automatically generated, you need to have the Office application to be installed on the Domino server hosting the Mail Flow Analyzer engine (Domino server).
Delivery Options
The Delivery Options tab display options used for the diffusion option of the generated report:
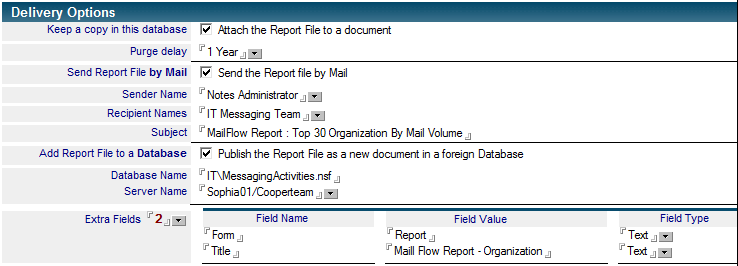
If the Attach the Report File to a document option is selected, the final report (Word, Excel or HTML file) is attached in a new document which is created in the Mail Flow Report database and found in the Reports / Report Document view. Reports documents can be automatically deleted via the Purge delay field.
In addition, the report can be automatically sent via the Send Report File by Mail option. In this case, fill in the Sender Name, Recipient Names and Subject to enable the sending of an email with the final attached report (groups are allowed as the Recipient Names is a multi-value field).
Lastly, the final report may also be published in a new document in a third party Notes database. If you need additional fields in the document, you can select the number of fields and the appropriate values in the Field Name, Field Value, and Field Type fields in the Extra Fields section. The final report (an Excel, Word or HTML file) will be available as a file attached into the document.
Appearance
The Appearance tab allows you to change the visual aspect of the Word based reports :

The Regional Settings section allows to specify the decimal separator (Decimal Symbol) and the digit separator (Digit Grouping Symbol) for formatting numbers in reports.
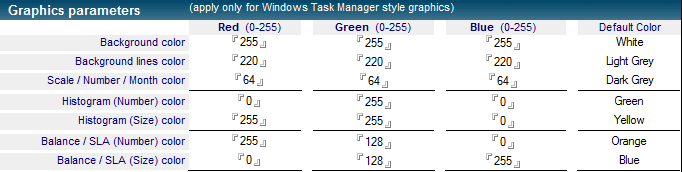
The Graphic parameters section lets you custom the colors used for statistics documents graphics. So you can match visual identity standard of the company.
Note: This tab is not accessible when you create Excel reports.
@Formula Repository
The @Formula Repository tab is used to keep the template file as simple as possible. So, You can drop your @Formula in this tab and report only the number of the @Formula field in the template file. For example, insert [#1] in the template file to display the formula result when the report is built :

Note: This tab is not accessible when you create Excel reports.
Action List
The Action List tab is only available for reports in Excel format. It allows the creation and management of additional rows and columns to simplify the generation of a report. The Compact option is used in the Reports as the Categorized rows in the views: You only keep 1 sample of each unique value of a data set.
Example : in the Data Origin tab (2nd tab of the Report Template document), you specified that the column containing the tag [MAIL_SERVER] should display the result of the computation of the @Formula (here @Name([CN]; MailServer)), but also adding the Action Unique_case, as below:

In the Action List tab, you specify the name of your action (here Unique_Case) in the Action Name field, and then have the ability to set automatic actions for the following Rows and for 3 following Columns. In the example below, the lines are set to the number of 11 (Top 10 + Extra Other line), with two additional columns: the first (#+1), shows the number of statistics documents matching the value of the [MAIL_SERVER] column (SCORE) and the next ones (#+2 and #+3) display the sum (SUM) of the computation of @Formulas @Subset(Y_Nb;1) and @Subset(Y_Sz;1):
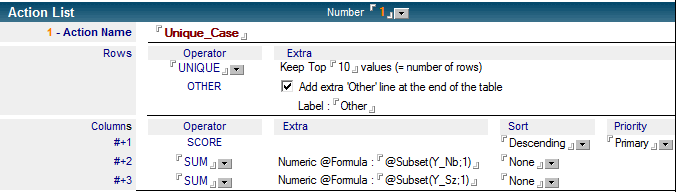
Note : By selecting None in the Sort column, the Priority column goes inactive.
In Excel Template File:

Raw date coming from Mail Flow User database:
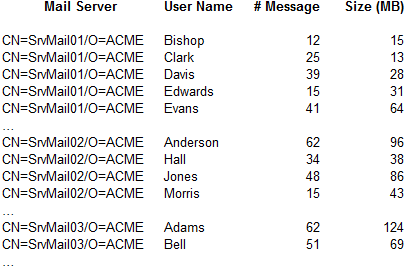
Once applied the Compact + Action:
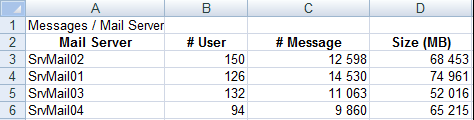
The column Server Name keeps only one sample of each individual Server name (UNIQUE). The # User Column displays the number of users (SCORE) having this Server Name as Mail Server. And Size (GB) Column is the SUM of number of messages (sent + received) and the size , for all users having this server as Mail Server.
3. Creating a Word Template Report |
|
|
To create a Word report, select Word from the Report File Format field, then attach a Word file in the Report Template file field. It would probably easier to start with a sample Word file provided with the product and modify it for your own needs. Word or Office 2003 (or later) must be installed on the computer where you build the reports (on the Domino server hosting the Mail Flow Engine or on the PC of the user).
In the tab called Data Origin of the Report Template, you must select the Number field where you specify the number of documents from which you want to extract information displayed in the final report. For each of them, you need to indicate the type (Type), the period (Period) and the unique identifier (ID):

Example of Word Report
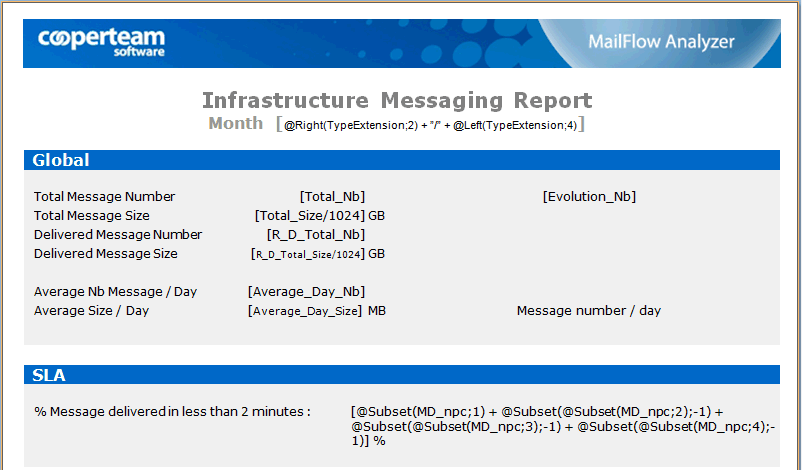
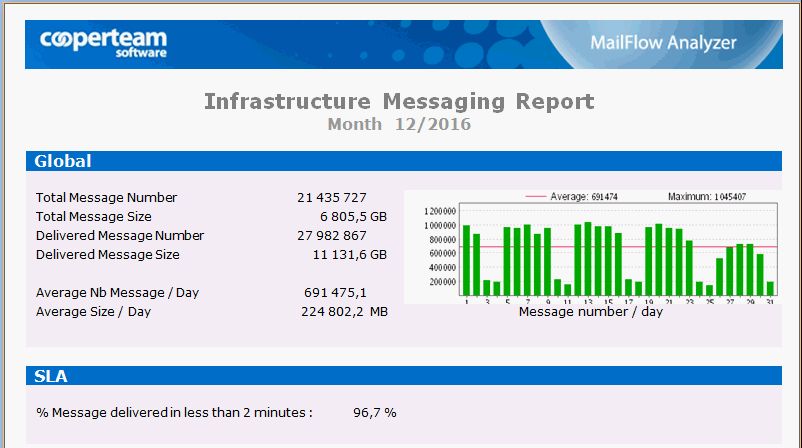
Below is a Word Template sample. The report engine will automatically replace the data between brackets ([Total_NB], [Total_Size/1024], [Evolution_Nb], [@Right(TypeExtension;2) + ...]...) by their value (field value or @Formula computation) and create the final Word Report. If the @Formulas are too long to feed on the Word Template, you can use the @Formula Repository tab to write them and use keywords [#1], [#2], [#3]... as reference.
A Word Template file:
A Word report file:
Word PDF Template Report
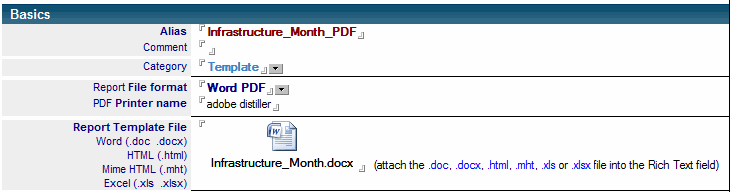
The Word PDF report templates look like the Word report templates. The difference comes from the output file format (a PDF file instead of a Word file). You simply have to fill PDF Printer Name field with the name of a printer creating the PDF file from Word application. The software utility building PDF file (for example adobe distiller) must be installed on the computer used to build reports (on the Domino server hosting the Mail Flow Engine or on the PC of the user).
HTML Report Template (Firefox)
HTML report templates look like Word report templates. They are usually built by updating, from Word application, an existing Word report template file into an file using the HTML format:
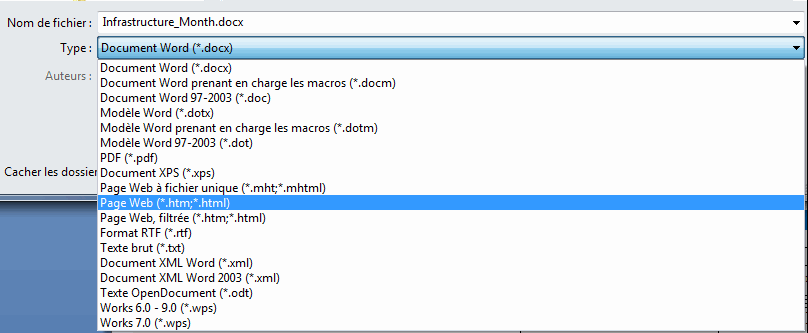
The difference comes from the output file format (a HTML file instead of a Word file). The advantage of the HTML format over the Word format is linked to the fact that installing Word application is not mandatory on the machine building the reports. On the other hand, the visual rendering is better on the Word file than on a HTML file.
Mime HTML Report Template (Internet Explorer)
Mime HTML report templates look like Word report templates and are usually built by updating, from Word application, an existing Word report template file into an file using the Mime HTML format:
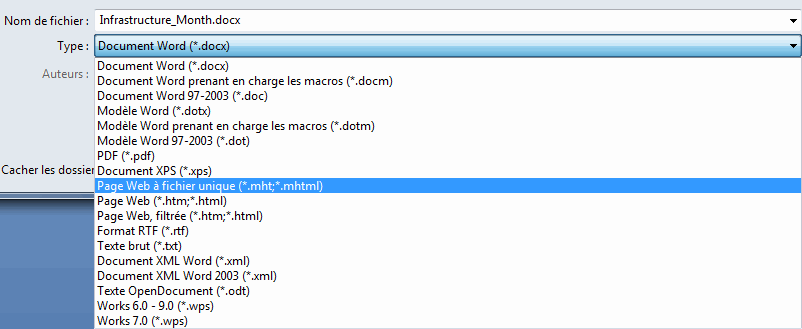
The difference comes from the output file format (a Mime HTML file instead of a Word file). The advantage of the Mime HTML format over the Word format is linked to the fact that installing Word application is not mandatory on the machine building the reports. On the other hand, the visual rendering is better on the Word file than on a Mime HTML file. Unlike an HTML file, the Mime HTML file format lets you encapsulate graphics in the Mime HTML file in order to obtain a better visual rendering than the basic HTML.
4. Creating an Excel Template Report |
|
|
To create an Excel report, select Excel from the Report File Format field then attach an Excel file in the Report Template file field. It would probably be easier to start with a sample Excel file provided with the product and modify it for your own needs. Excel or Office 2003 (or later) must be installed on the computer where you generate reports (on the Domino server hosting the Mail Flow Engine or on the PC of the user).
Excel format is a good choice to create Reports displaying values coming from several statistics documents (coming from Mail Flow Server or Mail Flow User databases). The Data Origin tabs gathers all data definition fields.

The Data Origin section contains the selection @Formula defining the list of statistics documents used to create the Report:

The Excel Data Cells section is used to define Cell values not related to the statistics documents previously selected. The [TITLE] tag can be used to add a Title to the Excel file, the [COUNT] tag can be used to display the number of statistics documents retrieved be the @Formula (or used to compute % in some cells). Extra Cell is used to compute any other kind of value (current Time / Date, Report creator name, ...):

The Excel Data Rows section lets you limit the number of statistics documents results displayed in the Report document (Maximum Number of rows: 30 rows) and gives you the possibility to sort your columns (Ascending or Descending). If you combine both, you can easily build TOP 100 reports, where you extract only the first 100 statistics documents, based on a specific criteria (size, number of messages...).

In the Excel Columns @Formula section, you define the list of [Tag] names found in the Excel Template file and their value (defined as Field Name or @Formula computed from the statistics documents):
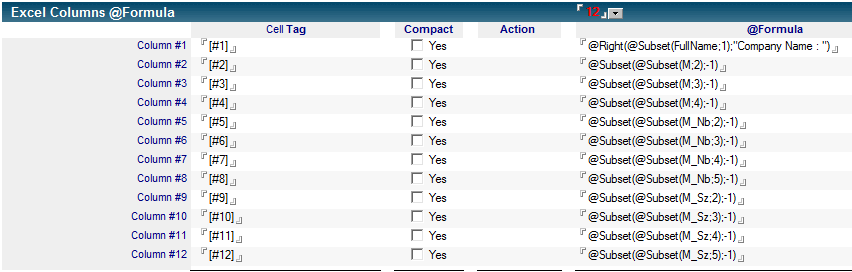
You can use the Action facility to build Compact style data, in the same way the Notes Client categorizes documents in the views. See Creating a Report Template documentation for more details.
You can also use the Excel Graphic facility to pump data from statistics documents and push them into the Excel file (in one Excel Sheet) as well as have the graphics automatically built in another Sheet:
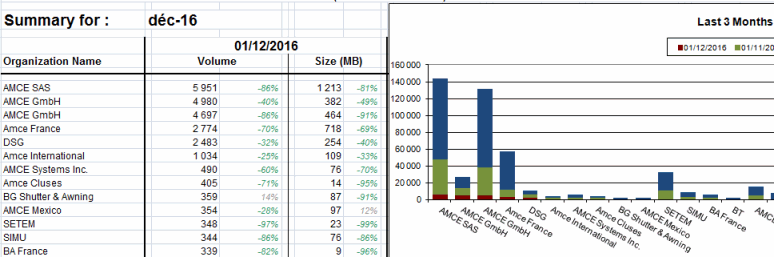
Example of Excel Report
Here is an Excel report sample with the final generated report. The cells from the template document show the keyword content as [#1], [#5], etc., allowing the report engine to replace these keywords by their values. In general, the report engine calculates the values of the @Formula fields first ([TITLE] + Extra cells) and then processes the Excel report to search the suitable place to insert the data. Each row of the Excel Report File contains value from one statistic document.
In the Excel Template:
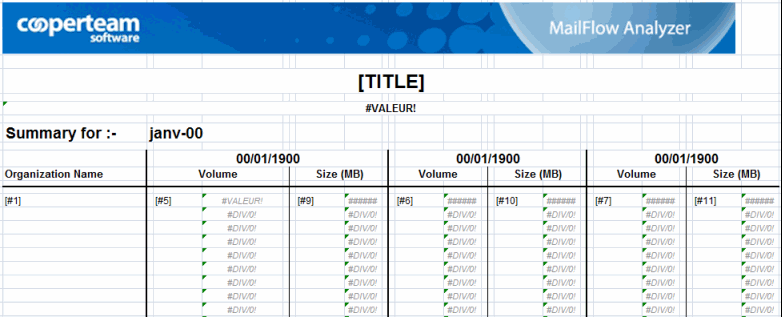
In the Excel Report:
5. Creating a Cross-Server or Cross-Population Report Template |
|
|
The Cross-Server or Cross-Population reports are used to build graphics displaying a flow between entities (flow between servers or flow between populations). We select a statistic coming from statistics documents (for example the number of mails sent between two severs coming from a Cross-Server statistics document) and we ask for a rendering of the flows, as a graphic. The names of the severs are displayed in blue circles and black arrows show the direction and the volume of the messages flow between servers. The red arrows identify the largest flows :
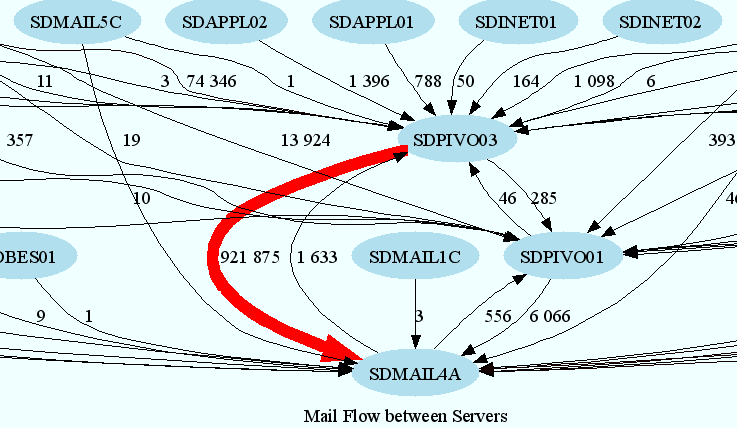
In order to create a Cross-Server or Cross-Population report Template, select CrossServer or CrossPopulation Graphic in the Report File Format field and chose the name of the graphic file.

The Data Origin tab contains all data definition fields.

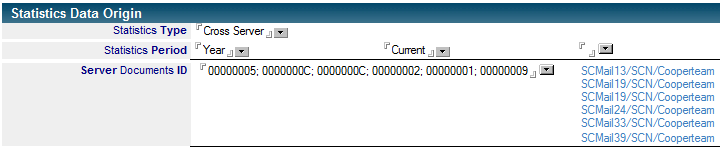
The Statistics Data Origin section contains the type of statistics documents to process (Cross Server or Cross Population), the target period (day, week, month, year...) and the list of statistics documents to be used (Document ID):
The Graphic / Table Data section is used to define the title of the report (Graphic Title), the names displayed inside the blue circles (Name @Formula) and the value (field name or @Formula) used for the arrows (below, the Total_Nb field indicates the number of messages sent between the two servers during the period).

The options from section Graphic Options are used to build easier-to-analyze graphics. We can ask to do not display arrows representing a very low level of traffic (Don't draw arrows if the value is lower than X %) or to draw the arrows going to a main server only (Draw arrows showing mail flow FROM / TO the Main Server).

The Appearance tab contains all the fields used to select the colors used in the graphic the type of the graphic.

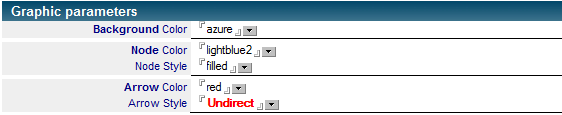
The graphic background color is defined by the Background Color field, the circle color is defined by the Node Color field and the color of the arrows is defined by the Arrow Color field. The Arrow Style field is used to define how the circles are aligned on the graphic (hierarchical or Indirect organization).
6. Creating reports using local components |
|
|
If you want to ask for an immediate creation of a report, from your PC, you need to to open the view Reports / Report Templates in Mail Flow Report database, select one or several Report Template documents and click the  /
/  . button. There is no need to install any additional software on your PC, since the button
  takes care of this automatically. The binaries are installed in the Data directory of your Notes client in the CTReport\Files\ReportFile\ sub-folder.
The following message lets you know that report creation is in progress in the background:
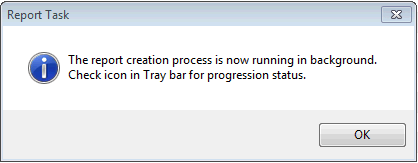
and the  icon in the notification zone of your Windows Task bar indicates its progress (in the lower right part of the screen). You can also go to the Reports / Report Documents view and wait for the Report document to become available. Sort the view by clicking the Creation Date column, and your document should be on the top.
The on-demand report creation from your PC is going to use the Microsoft Office Word or Excel software installed on your PC. In order to create Word or Excel reports from your PC, you need you need to ensure that the Microsoft Office tools Word and Excel are installed on the PC.
Creation of reports on the Server
In order to ask for an immediate creation of report on the Domino server hosting the Mail Flow Engine, you need to open the view Reports / Report Templates in the Mail Flow Report database, selection one or several Report Template documents and click the  /
/  button. The Mail Flow Engine is going to catch the reports creation request and will build the reports documents, using Microsoft Office Word and Excel software installed on the Domino server. You need to ensure that the Microsoft Office tools Word and Excel are installed on the server. You should also ensure that the authority under which Domino is running has access to this software on the server.
For reports based on a large number of statistics documents, it is faster to build them on the server because the Mail Flow Engine can access to these statistics documents directly from the local databases Mail Flow Server and Mail Flow User. At the opposite, the local task in charge of creating reports from your PC have to download, from the server, all statistic documents used to build the reports. This network usage takes some times.
The scheduling for report creation o,n the server can be configured in the Scheduling tab from Report Template documents :
Viewing the Report document
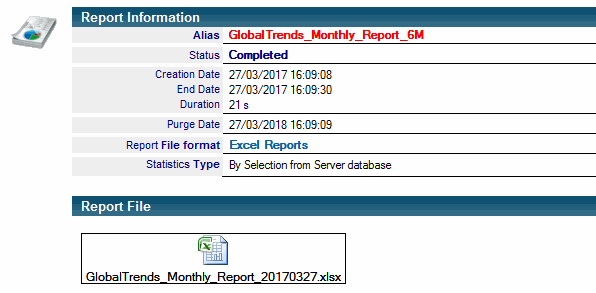
Once the report has been generated, you will find a new document in the Reports / Report Document view view that contains your report, as follows:
Trace Files
During the background creation of a report, temporary files (Value_pid.txt, Template_pid.xls, Report_pid.xls...) are created in the Notes Data directory, in the CTReport\Files\ReportFile\ sub-directory. These files are deleted once the report has been created.
In addition, the Trace files for the report creation process are generated in the %Temp% directory of the machine and are called ReportTaskLog_yyyymmdd_hhmmss_pid.txt and MailFlowReportLog_yyyymmdd_hhmmss_pid.txt. The Temporary files and the Trace files can be used to analyze the problem if reports are not built as expected.
Troubleshooting
If you can't get your report created, the first thing to do is to have your report created on local (on your PC). It is easier to debug. You can access the Trace file, look at the temporary files and make sure Excel and Word are working properly.
If the problem seems to come from Word or Excel, you can click the Enable Debug Mode option in the Report Template:
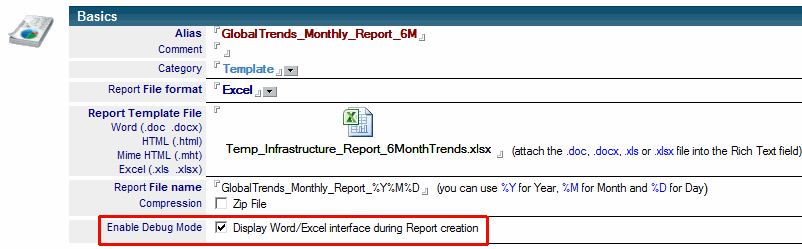
This will force Word or Excel to be displayed on the screen during the Report creation. If an error message pops up, you will see it. Common errors messages come from Excel or Word file formats. Make sure you use the right extension (like .xlsx or .docx) if you are using the latest Word or Excel release (and not .doc or .xls) in order to prevent any warning messages asking if you want to enable compatibility mode.
If the Report works fine on local, but does not work on the Server, check the following common errors list:
- Check that the CTReport\ folder is available in the Server Data directory, with all required files inside (you can compare with the files installed on your local PC).
- If the Domino Server is 64 bits, use ReportTask.exe in 64 bits. If Domino Server is 32 bits, use ReportTask.exe in 32 bits.
- Make sure Excel & Word have been installed and started at least once, as the installation process initializes many items during the first start-up before it is complete.
- If the server is running Windows 64 bit, make sure the following folder exists: "c:\Windows\SysWOW64\config\systemprofile\Desktop\". If not, create it.
Comments
0 comments
Article is closed for comments.