
 |
 |
1. Overview |
| 2. Core Statistics | ||
| 3. Mail Flow User database | ||
| 4. Mail Flow Server database | ||
| 5. Mail Flow Stat database | ||
| 6. Mail Flow Dashboard database |
1. Présentation des bases |
|
|
 Back to Top
MailFlow Analyzer catch and analyze all the details regarding the messaging flow of the Domino infrastructure. A huge amount of statistics is collected and made available in real time into Notes databases. This topic presents all available statistics and helps you to understand them.
The statistics documents are stored in the 4 following Notes databases:
|
|
|
|
|


Mail Flow Server
This database contains all the statistics built for the global Infrastructure, the Sub-Infrastructures, the Populations, the Flow between Populations, the Servers and for the Flow between Servers. The statistics are delivered into Notes documents, covering different periods of time:
- ALL 1 document gathering all statistics from the beginning
(since the installation of the product) - YEAR 1 document per year (we keep a rolling 5 years period)
- MONTH 1 document per month (we keep a rolling 12 months period)
- WEEK 1 document per week (we keep a rolling 5 weeks period)
- DAY 1 document per day (we keep a rolling 7 days period)
Mail Flow User
This database contains all the statistics built for the Users, the Mail-in databases, the NAB Groups and also for virtual groups of users based on their belonging to a Organization Unit (By Certification), a Mail server (By Mail Server) or having common values in their Person document of the NAB, such as the name of the company (Company Name), the name of the location (Location) or the department they are working on (Department).
Mail Flow Stat
The statistics available in this database are a sub-set of the statistics available in both databases Mail Flow Server and Mail Flow User. Mail Flow Stat has been designed to be the public version of statistics available in User and Server database. This database can be opened using an Web browser or a Notes client. The kinds of statistics exposed in this database are defined in the Setup document located in the Mail Flow database.
Mail Flow Dashboard
This database can only be accessed by a Web Browser. It provides some dashboards related to global Infrastructure statistics, for current week, month and year periods. This is a summary of key figures about messaging flow, easy to share with people not authorized to access the inner databases of the Mail Flow application.
2. Core Statistics |
|
|
The different statistics available in the Mail Flow Server and Mail Flow User database have some topics in common. We will present them here. We are going to use screen capture from the Infrastructure statistics, but you will find the same ones on the other types of of statistics (Population, Cross-Population, Server, Cross-Server, User, Group of Users...).
Every statistics document is divided into tabs (Identity, Global Traffic, Sent, Received...):
The name of the Tabs will change according to the type of the statistics document (Infrastructure, Population, Server User...) but the main topics (sent mails sent, received mails, origin of messages, types of attach files, delivery options...) will be available in all documents.
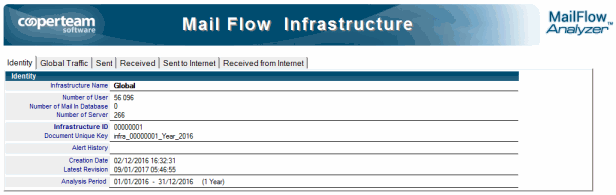
The first tab is usually named Identity, it describes the content of the document and its perimeter:


 : Name of the infrastructure
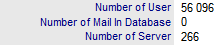 : Number of users, number of Mail-in databases and number of Servers member of this infrastructure
 : Internal identifier for this type of document
 : Unique key of the document, where we can find the type of the statistic (Infra), the internal identifier, the type of period (Year) and the identifier of the period (year 2016)
 : Creation date of the document
 : Latest modification date
 : Period of time for this statistics document (here, the year 2016)
The following tabs show the statistics. They can be split into sub-tabs (up to 3 levels):

Le premier niveau contient les onglets suivants :
- Global Traffic Messages sent or received by the Users of the Company
- Sent Messages sent by the Users of the company
- Received Messages received by the Users of the company
- Sent to Internet Messages sent to Internet by the Users of the Company
- Received from Internet Messages, coming from internet, received by the Users of the company
The tabs Sent, Received, Sent to Internet and Received from Internet shows a subset of the message traffic available in tab Global Traffic. The tab Sent to Internet is itself a subset of what can be found in tab Sent. More you go on the right, more the tabs get specialized.
Under every tab of the first level (Global, Sent, Received...) showing statistics for all messages (Global) or a subset of messages (Sent, Received...), there are a set of tabs of second level (Main, Origin, Destination, Delivery Options, Misc, Attach Files, Balance...) showings statistics regarding the messages of this group.

Every tab is divided into two similar areas:
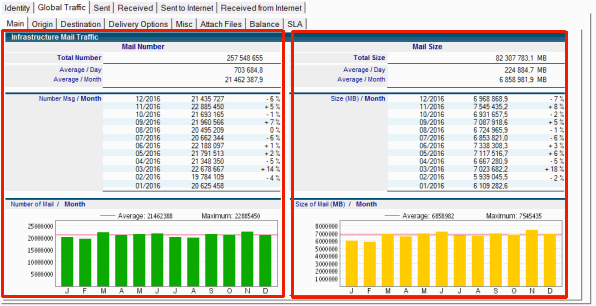
On the left, we find statistics regarding the number of messages, on the right, the statistics are about the sizes of the messages. For some types of statistics, it is more interesting to use the number of the messages while for others, it is more interesting to rely messages side.
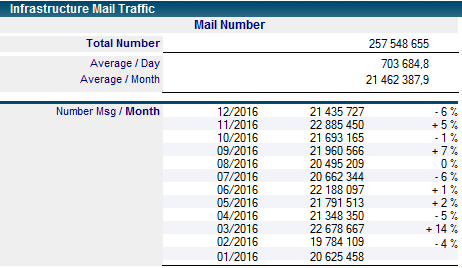
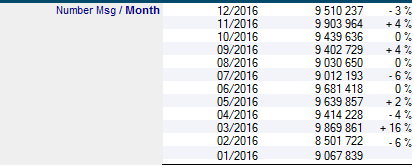
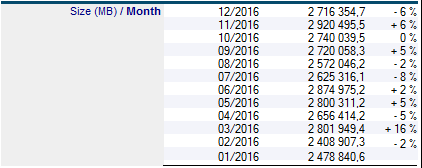
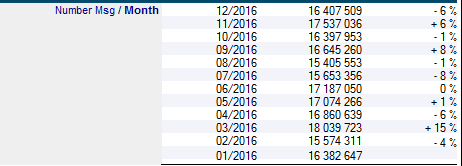
Whatever we wish the number of messages or the size of messages, we provide the total number (Total Number) for the period (here, one year), the average per day (Average / Day) and per month (Average / Month). We also display details numbers about the latest 12 months (Number Msg / Month) and their evolution (as a %):
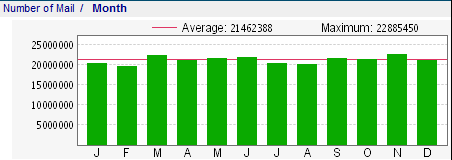
The green graphic displays the evolution of the number of messages routed in the infrastructure, for the last 12 months of the year 2016:
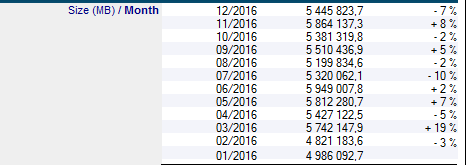
The yellow graphic displays the size of messages routed in the Infrastructure, for the last 12 months of the year 2016:
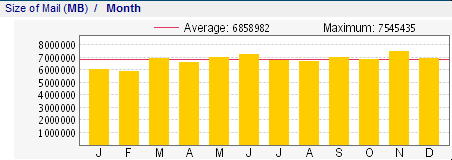
Even if the tendencies of the two graphics are close, they are not the same because the size of the messages is not 100% linked to the number of document (but also to the unit size of the each message).
Concepts
Before going deep in the all the statistics available in documents located in databases Mail Flow Server and Mail Flow User, we must start by explaining few basic concepts. They are not numerous and they will help you to better understand all the numbers, they way they are computed and their inner limits.
Unique Message
When we count the number of messages routed in the in the infrastructure, we are going to talk about unique message. If User A sends a message to User B, we are going to count 1 message. If User A send 1 message to 3 recipients (B, C and D), we are also going to count 1 message. Even if the message has been distributed to 3 persons, there is only one message which has been routed in the infrastructure and its content was always the same (for the 3 recipients).
In all the statistics (Global, Sent, Received, Sent To Internet, Received From Internet), a message can't be counted more than once in each statistic, whatever is the number of recipients:
Global 1, whatever the message is
Sent 1 if the message has been sent by an internal user, 0 if not
Received 1 if the message had, at least, one internal recipient , 0 if not
Sent to Internet 1 if the message had, at least, one internet recipient, 0 if not
Received from Internet 1 if the sender of the message comes from internet, 0 if not
The number of recipients plays a role in few statistics, but it is rare:
Global Traffic / Destination :

Sent / Destination :

Received / Delivered :
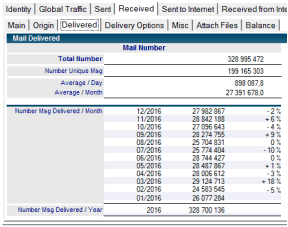
We only take into account the internal recipients, the ones receiving the message in their mail files.
Sent to Internet / Main :

Internal / Internet
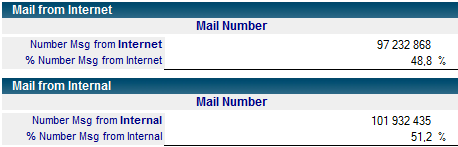
In order to find the origin (Mail from) of a message routed in the infrastructure, we are going to use the email address of the sender of the message to find out if it is someone available in the NAB of the company (message coming from someone internal to the company : Internal) or it is an unknown SMTP address, so coming from outside of the company (Internet). A message routed in the infrastructure is either Internal (from inside the company) or Internet (from outside of the company). IT can be both or can't be none of them. The sum of % From Internet + % From Internal = 100 %:
Sent
There are the messages sent by Users of the company. The statistics are about the number of sent unique messages (independently of the number of recipients). Every message sent from the company is counted as 1 in the statistic Total Number:
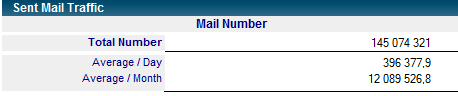
For statistics about the destination of the messages, we are going to count 1 in the statistic To Internal if at least one of the recipients is inside the company (internal) and as 1 in the statistic To Internet if at least one of the recipient is outside of the company (internet recipient). Because one message may have several recipients (some of them as internal users and some of them as external users), we may count 1 for the two statistics together. So we may have % Sent To Internet + % Sent to Internal >= 100 %:
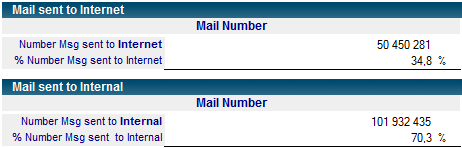
There is no mistake in the statistics but simply messages that can be in both categories (To Internet and To Internal) in the same time. IT is true to say that 34,8 % of the messages have been sent to Internet and that 70,3 % of the messages have been sent to internal recipients.
Global = Sent + Received From Internet
Every message routed in the infrastructure (Global) comes from either an internal User (Sent) or from a User outside of the company (Received From Internet). We can write the following formula:
Global = Sent + Received From Internet
And we can check the numbers:
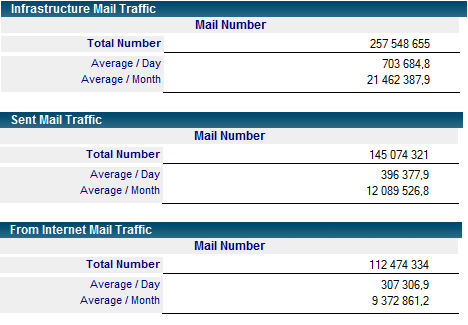
We might think that Global = Sent + Received but is it wrong because if internal User A send a message to another internal User B, this message will be counted as 1 in the Global statistic, as 1 in the Sent statistic (because sent by an internal user) and as 1 in the Received statistic (because received by an internal user). So we will get an equation like Global (1) = Sent (1) + Received (1) which is false. Indeed, the received message is the same that the one which has been sent, we count twice the same message and we know that Global count unique messages only. You have to take care of the numbers coming from the statistics in order to not count the same message several times.
Log Scale
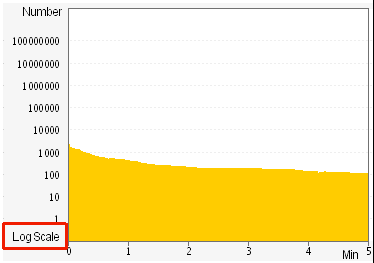
Regarding the option checked in the Setup document (Statistics / Global Settings / Graphics parameters / Vertical Scale), you may get graphics with a logarithmic scale (Log Scale) applied to the vertical axis vertical. This is useful when low level values are mixed with high level values, in order to do not crush the low level ones. The presence of keyword Log Scale in the lower left corner of the graphic will warn you about the usage of log scale (you may also notice that the graduation of the vertical axis is not linear):
Statistiques Communes

The following numbers come from an Infrastructure statistics document, covering 1 year period. For the other periods (day, week, month), the graphics and the tables will be a little bit different.
Main
Main tabs shows the total number of messages, regardless their origin or their destination (see next tabs).

 : total number of messages
 : Average of the number of messages per day
 : Average of the number of messages per month
 : Total size of the messages
 : Average of the size of the messages per day
 : Average of the size of messages per month
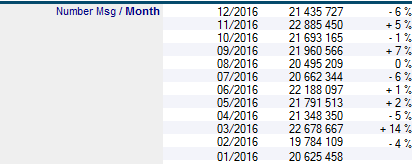
Evolution of the number of messages for the last 12 months
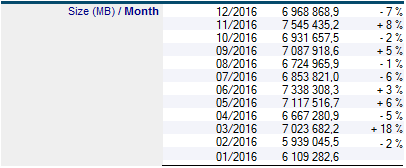
Evolution of the size of the messages for the last 12 months
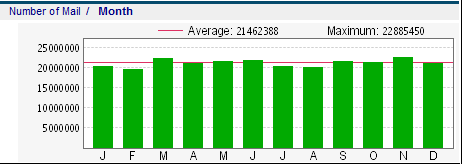
Graphic showing the number of messages per month. The average and the maximum values are shown on the top of the graphic.
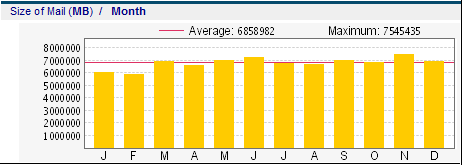
Graphic showing the size of the messages per month. The average and the maximum values are shown on the top of the graphic.
Origin
The Origin tab is split into two sub_tabs : From Internal and From Internet in order to make a difference between messages coming from the company (Internal) and those coming from outside (Internet).


 : Number of messages sent from the company
 : Percentage of messages sent from the company (compared to the total number of messages).
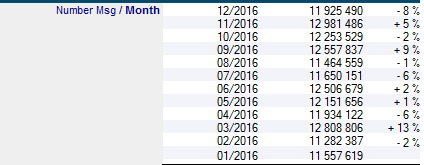
Evolution of the number of messages sent from the company for the last 12 months.
 : Size (in MB) of the messages sent from the company
 : Percentage of the size of messages sent from the company (compared to the total size of the messages).
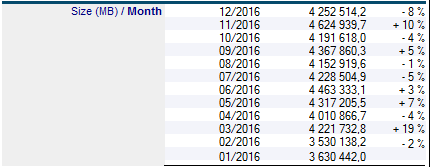
Evolution of the size of the messages sent from the company, for the last 12 months.
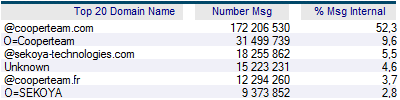
Top 20 of the main Notes domains (/O=) or Internet domains belonging to the company, used to sent messages to internal recipients. We count the number of messages sent and the % related to the total number of messages sent from the company.
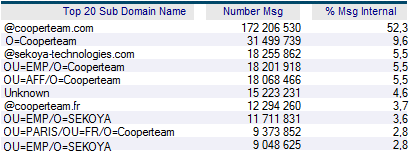
Top 20 of the Notes sub domains (/OU=) or Internet domains belonging to the company, used to send messages to internal recipients. We count the number of messages sent and the % related to the total number of messages sent from the company.
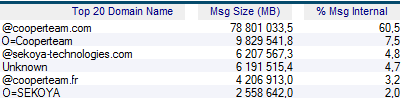
Top 20 of the main Notes domains (/O=) or Internet domains belonging to the company, used to sent messages to internal recipients. We count the size of the messages sent and the % related to the total size of message sent from the company.
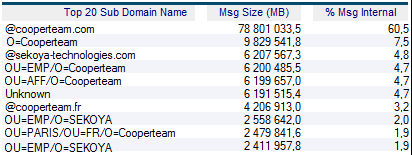
Top 20 of the Notes sub domains (/OU=) or Internet domains belonging to the company, used to send messages to internal recipients. We count the size of the messages sent and the % related to the total size of message sent from the company.

List of unknown internal domains. We know that the email address of the sender in not an Internet address but we can't find in the NAB any reference (Person document, Group document, Mail-In database document...) related to this address. So we list here all those unknown internal domains

 : Number of messages received from Internet
 : Percentage of messages received from Internet (compared to the total number of messages).
Evolution of the number of messages received from Internet for the last 12 months.
 : Size (in MB) of the messages received from Internet
 : Percentage of the size of messages received from Internet (compared to the total size of messages).
Evolution of the size of messages received from Internet for the last 12 months.
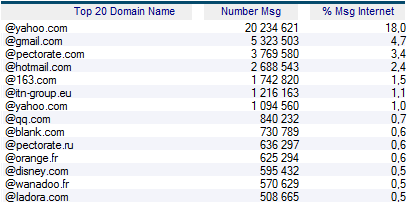
List of the Top 20 Internet domains where the Internet messages have been sent from. We count the number of received message and the % related to the total number of messages received from Internet.
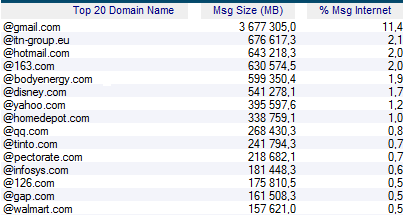
List of the Top 20 Internet domains where the Internet messages have been sent from. We count the size of the messages received from Internet and the % related to the total size of messages received from Internet.
Destination
The Destination tab is split into two sub-tabs : To Internal and To Internet in order to make a difference between messages having recipients in the company (Internal) and those having recipients outside of the company (Internet). A message having at the same time recipients in the company and outside of the company will be displayed in both sub-tabs:


 : Number of messages sent to internal recipients.
 : Percentage of the messages sent to internal recipients (compared to the total number of messages).
Evolution of the number of messages sent to internal recipients for the last 12 months.
 : Number of messages sent to internal recipients multiplied by the number of internal recipients.
 : Size (in MB) of the messages sent to internal recipients.
 : Percentage of the size of messages sent to internal recipients (compared to the total size of the messages).
Evolution of the size of messages sent to internal recipients for the last 12 months.
 : Size of each message sent to internal recipients multiplied by the number of internal recipients. This is useful to compute the impact of sent messages.
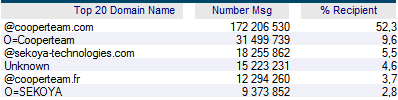
Top 20 of the main Notes domains (/O=) or Internet domains belonging to the company, where the messages sent from the company have been sent. We count the number of messages sent and the % related to the total number of messages sent from the company to internal recipients.
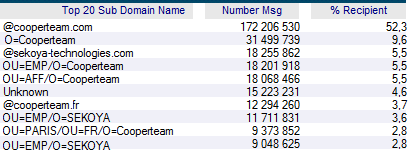
Top 20 of the Notes sub domains (/OU=) or Internet domains belonging to the company, where the messages sent from the company have been sent. We count the number of messages sent and the % related to the total number of messages sent from the company to internal recipients.
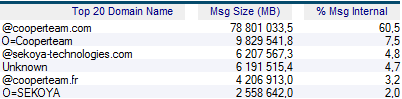
Top 20 of the main Notes domains (/O=) or Internet domains belonging to the company, where the messages sent from the company have been sent. We count the size of messages sent and the % related to the total size of messages sent from the company to internal recipients.
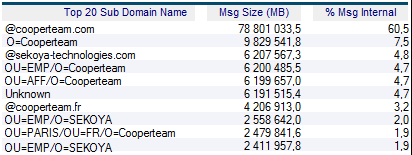
Top 20 of the Notes sub domains (/OU=) or Internet domains belonging to the company, where the messages sent from the company have been sent. We count the size of messages sent and the % related to the total size of messages sent from the company to internal recipients.

List of unknown internal domains. We know that the email address of the recipient in not an Internet address but we can't find in the NAB any reference (Person document, Group document, Mail-In database document...) related to this address. So we list here all those unknown internal domains.

 : Number of messages sent to Internet.
 : Percentage of messages sent to Internet (compared to the total number of messages).
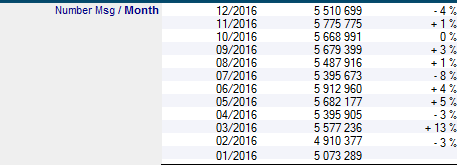
Evolution of the number of messages sent to internet for the last 12 months.
 : Number of messages sent to Internet multiplied by the number of the internet recipients.
 : Size (in MB) of the messages sent to Internet.
 : Percentage of the size of the messages sent to Internet (compared to the total size of the messages).
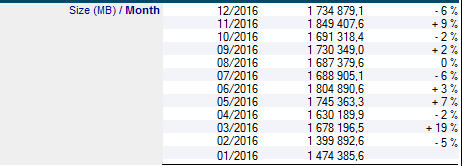
Evolution of the size of the messages sent to Internet for the last 12 months.
 : Size of each message sent to Internet multiplied by the number of Internet recipients. This is useful to compute the impact of the sent of messages.
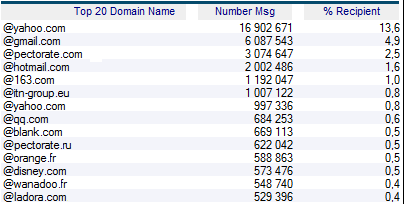
List of the Top 20 Internet domains where the messages have been sent to. We count the number of sent messages and the % related to the total number of messages sent to Internet.
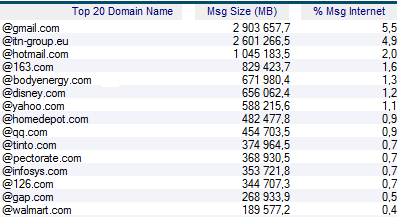
List of the Top 20 Internet domains where the messages have been sent to. We count the size of sent messages and the % related to the total size of messages sent to Internet.
Delivery Options
This tab is about the statistics regarding the messages security options, the messages routing options and messages delivery options. We show here the statistics about the number of messages but the same ones are also available for the size of messages.

 : Number of signed messages
 : % of signed messages.
 : Number of encrypted messages.
 : % of encrypted messages.
 : Number of messages using Mime format.
 : % of messages using Mime format.
 : Number of message having the Return Receipt option.
 : % of messages having the Return Receipt option.
 : Number of messages having the Prevent Copying option.
 : % of messages having the Prevent Copying option.
 : Number of messages having the No Notify if out of office option.
 : % de messages having the No Notify if out of office option.
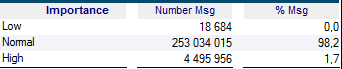 : Importance of the messages.
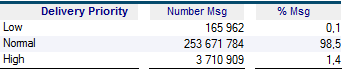 : Delivery Priority of the messages.
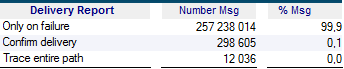 : Delivery Options of the messages.
 : Number of messages routed during business hours and outside of business hours.
Misc

The first table is about the types of messages (value of Form field) routed in the infrastructure. We find here classic types of messages (Memo, Reply, Forward), the types linked to calendar entries (Notice) and those linked to messages routing (Delivery Failure, Return Receipt, Delivery Report, NonDelivery Report...). If the Form field of the message is empty, we use the keyword Unknown to count them. If Notes applications are sending documents by mail, the value for the Form field of these documents will be available in the table.
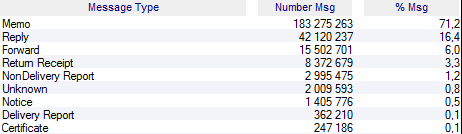
The second table is about the distribution of the number of recipients in the messages:

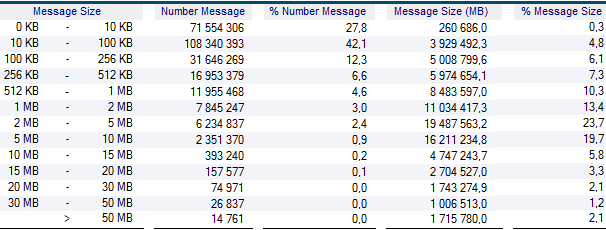
The third table is about the distribution of the size of the messages:
Attached Files
This tab is about files attached into messages.

 : Number of attached files.
 : % of messages having attached files.
 : Total size of attached files.
 : % of the size of attached files compared to the size of messages.
 : Number of attached files considered as Junk files.
 : % of the attached files considered as Junk files.
 : Total size of junk attached files.
 : % of the Junk attached files.
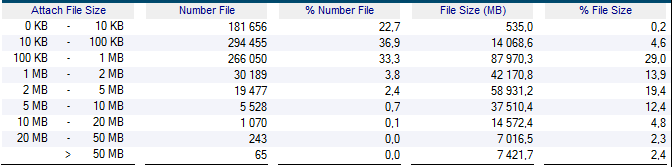
In the following table, we display distribution of the size of the attached files in the messages:
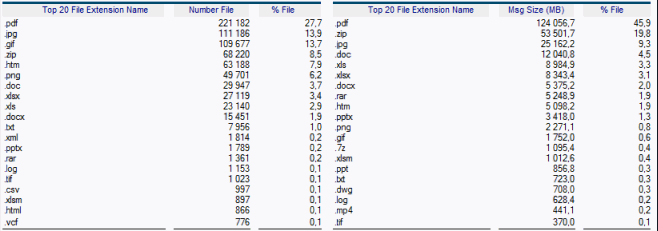
In the table, we sort all attached files by extension, keeping only the Top 20 (in number and in size):
Balance
Those two graphics show the distribution of the number of messages (in orange) and the distribution of the size of message (in blue) processed during the 24 hours of the day (midnight - midnight). We usually note a start of activity around 8 AM (beginning of the business hours), a drop of activity between noon and 1 PM (lunch break) and a slow down starting at 6 PM (end of business hours):
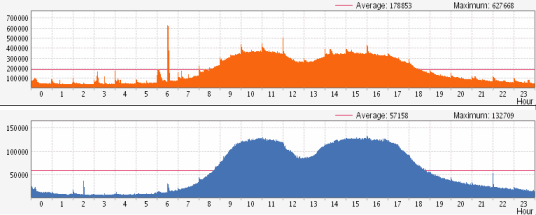
The curves fit with the business hours of the day, where the users activity take place. These curves can be used to highlight periodic behaviors such as the sent of out not office notices at 4 AM. In case of incidents, we can use these graphics to visualize peak of production. In the above graphics, we can see a peak of message sending at 6 AM. We can clearly identify it on the graphic showing the number of messages (orange) but it is not that visible on the graphic showing the size of messages (blue). We can conclude that there are a lot of small size messages.
SLA
The SLA is the number of seconds took by a message to go through the infrastructure, between its introduction (sent from internal or received from Internet) up to its way out (delivered to a internal mail file or sent to an internet gateway). We con consider the SLA as an indicator of quality for messages routed in the infrastructure. For the SLA value, less-is-better rule apply. The time required for a message routing is linked to several factors such as the number of crossed servers, the load of the servers, the number of recipients of the message, the antivirus and antispam processing...
The statistic table show the distribution of the routing duration of the messages:
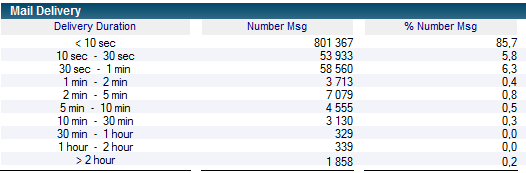
The first lines of the table must be read as:
85,7 % of the messages have been distributed in less than 10 seconds
5,8 % of the messages have been distributed between 10 and 30 seconds
6,3 % of the messages have been distributed between 30 seconds and 1 minute
The several duration levels are defined in the Setup document of the application (in MailFlow database).
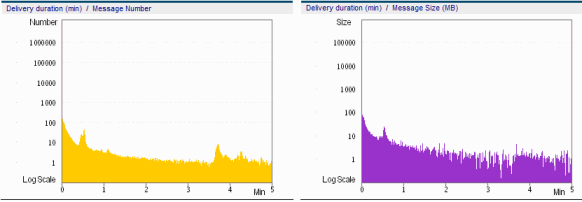
The two following graphics show the distribution of the SLA value for the first 5 minutes, related to the number of messages (in yellow) and related to the size of the messages (in purple). Beware, the vertical scale of the graphic may by logarithmic:
3. Mail Flow User database |
|
|
The Mail Flow User database is hosted on the Domino server running the data processing engine. It can be accessed using a Notes client.

The database contains statistics documents for all the identities defined in the NAB, having the ability to send or receive messages:
- The Persons
- The Mail-In databases
- The Groups (Multi-purpose or Mail Only)
The database contains also some statistics documents for virtual groups of users defined in the Setup document of the Mail Flow database:
- Group of Users : By Mail Server Consolidation of all users having their Mail databases on the same Mail Server
- Group of Users : By Certificate Consolidation of all users having the same Organization Unit /OU=
- Group of Users : By Organization Consolidation of all users sharing the same values in some of the fields (Department, Location, CompanyName) of their Person document.
The left navigator of the Mail Flow User database lets you select the views linked to the different types of statistics documents:
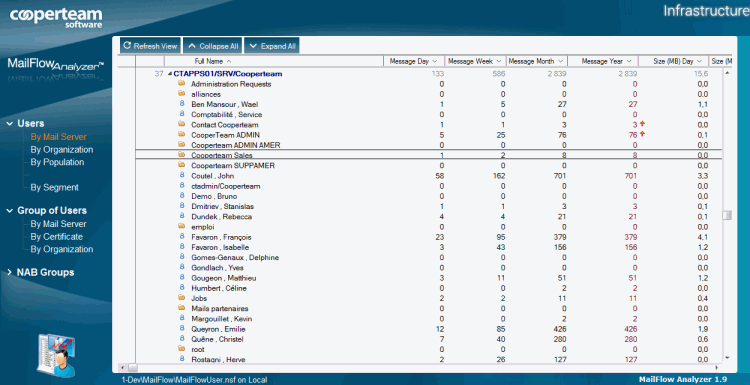
The columns of the views display the identity of the documents (person name, Mail-in database name, name of the group...) and statistics about messages sent and received for current day, week, month and year periods. The red arrows 
 indicate that the statistics numbers have increased
  or decreased
  in a more important way than the Warning level defined in the Setup document of the Mail Flow database:

User Statistics
All the documents available in the Mail Flow User database are built in the same way, with 4 main Tabs:

Identity
The Identity tab displays information related to the user / the mail-in database / the group of users, such as the identities, the path of the Mail file, the Population he is member of, the Segment he is linked to, the Alerts which have been raised due to the messages he has sent ...

 : Last Name of the user.
 : First Name of the user.
 : List of ShortName for this user.
 : List of FullName for this user.
 : Internet Address of the user.
 : File Path of the Mail database of the user.
 : Name of the Mail Server of the user.
 : Name of the Mail Domain of the user.
 : List of Populations names to which this user is attached.
 : List of Group of User : By Organization names to which this user is attached.
 : Name of the Segment to which this user is attached.
 : Unique Key used to define this user in Mail Flow application.
 : List of the statistics alerts raised after the update of this document.
 : Creation date of this statistic document.
 : Latest modification date of this statistic document.
 : Period of time for the statistics of this document.
Regarding the type of document (Person, Mail-In Database, NAB Group, Virtual Group) Identity tab displays contextual information:
-
Mail-in databases:
 : The fact that this entry is a Mail-In database is reminded at the same level than the FullName, in parenthesis.
-
Virtual Groups of users:
 : Name of the Group, number of users member of this group.
-
NAB Groups:
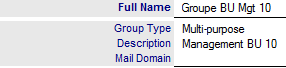 : Name of the group, Type of the group, Description and mail Domain.
-
Global
The Global tab show the consolidation of messages sent and received by this user / this mail-in database / this group of users. We find there the total number of message and the total size of messages, with an Internet / Internet split :

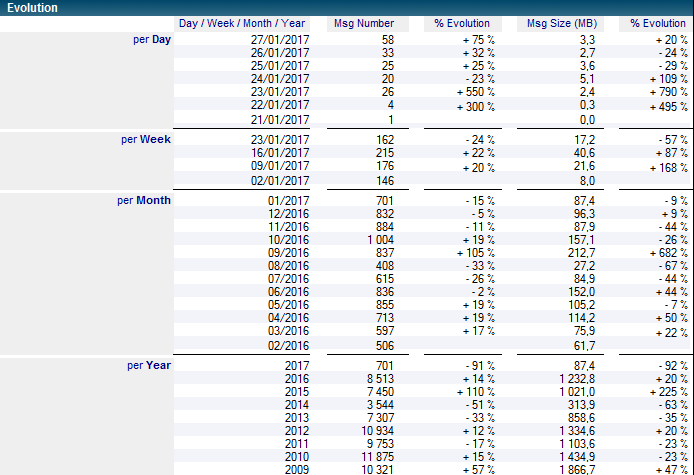
We also find the evolutions of the number of messages and the size of messages, for the rolling periods (days, weeks, months and years) :
-
Sent
The Sent tab contains statistics about the messages sent by this user / this mail-in database / this group of users.

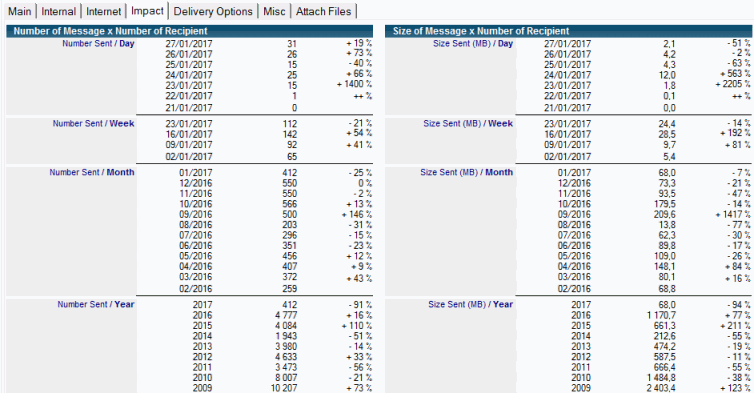
The Impact tab shows the statistics about sent messages, taking account of the number of recipients in the messages:
-
Received
The Received tab contains statistics about messages received by this user / this mail-in database / this group of users.

In the Delivery Options Tab, an extra statistics displays the number of messages where the user is one of the the primary recipients of the message (SendTo):

4. Mail Flow Server database |
|
|
The Mail Flow Server database is hosted on the Domino server running the data processing engine. It can be accessed using a Notes client.

The database contains the following statistics documents :
- Infrastructure Messages routed through the Domino servers of the company.
- Sub-Infrastructure Messages routed through the Domino servers member of this sub-infrastructure.
- Server Messages processed by a Domino server.
- Cross-Server Messages flow exchanged between two servers.
- Population Messages sent or received by the members of this population.
- Cross-Population Messages flow exchanged between two populations.
Every statistic document cover a period of time (1 day, 1 week, 1 month, 1 year). We keep, for each rolling period, a fixed number of statistics documents. So we can have up to 30 documents for each type of statistics :
- 1 document covering all periods (All)
- 5 documents Year
- 12 documents Month
- 5 documents Week
- 7 documents Day
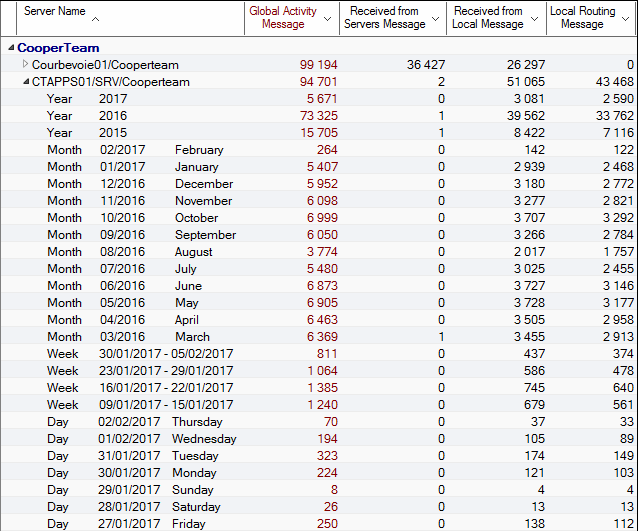
The statistics document covering periods Year / Month / Week / Day are attached to the All statistics document as response documents. This All document takes as name the identity of the statistics document : name of the Infrastructure, name of the Server, name of the Population... (you see below the set of statistics document for server CTAPPS01/SRV/COOPERTEAM). The other documents display information about the period they cover (Year 2017, Year 2016, Year 2015, Month 02/2017...):
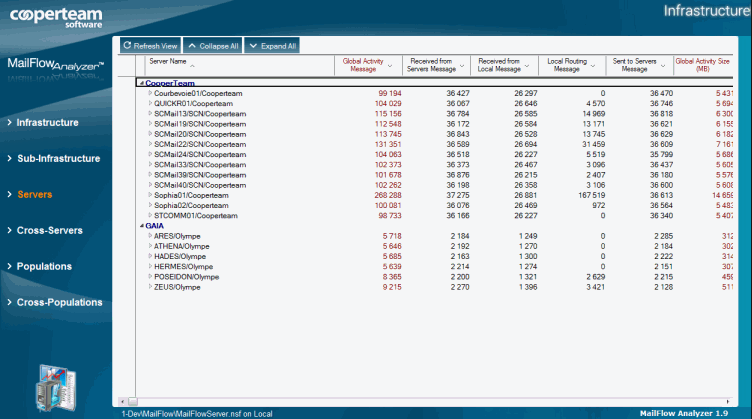
The left navigator of the Mail Flow Server database lets you select the views linked to the different types of statistics documents :
Infrastructure Statistics
The statistics document for types Infrastructure and Sub-Infrastructure are built on the same format, with 6 main tabs:

-
Identity

 : Name of the infrastructure.
 : Number of Users and number of Mail-in databases members of this infrastructure.
 : Number of Domino servers in the infrastructure.
 : Unique Key for this Infrastructure statistics document in Mail Flow Analyzer product.
 : List of Alerts (based on Statistics) raised during the updates of this document.
 : Creation data of this statistics document.
 : Latest modification date of this statistics document.
 : Period of time for the statistics of this document.
-
Global Traffic
The Global Traffic tab displays statistics about all messages routed through the Domino servers members of this Infrastructure.

-
Sent
The Sent tab displays statistics about all messages sent by the users / Mail-in databases of this Infrastructure.

-
Received
The Received tab displays statistics about all messages received by the users / Mail-in databases of this Infrastructure.

-
Sent to Internet
The Sent to Internet tabs displays statistics about all messages sent by the users / Mail-in databases of this Infrastructure to Internet recipients.

-
Received from Internet
The Received tab displays statistics about all messages received by the users / Mail-in databases of this Infrastructure, coming from internet.

Server Statistics
The Server statistics documents are built with 6 main tabs :

The statistics regarding the servers differ from the statistics about other types of documents (Infrastructure, Cross-Server, Population, Users...) For the server statistics, we do not care about a flow of messages but we car about the activity of the Domino server, sum of 4 distinct messages flow:
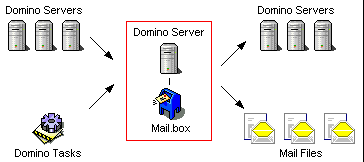
The flows entering in the mail.box of the server :
- Received from Servers Messages coming from other Domino servers of the infrastructure.
- Local Processes Messages coming from local Tasks of the Domino server (server, smtp, http, traveler...)
The flows exiting from the mail.box of the server :
- Local Routing Messages locally delivered into the mail database hosted on the server
- Sent to Servers Messages sent to other Domino servers of the infrastructure.
The statistics about the incoming flows are about the same that the statistics about the outgoing flows (every messages entered in the mail.box must exit), but a difference will always exist due to the number of recipients in a message. In fast, the Received from Servers, Local Process and Send to Servers flows will be about unique messages while Local Routing flow takes into account the number of recipients. So, 1 message which comes from another Domino server (Received from Server = 1) may be delivered to 2 Mail databases hosted on the server (Local Routing = 2).
Regarding the usage of the Domino server, all the flows are not necessarily available :
- A Domino server without mail file won't have any Local Routing flow.
- A Domino server configured as an incoming SMTP Gateway won't have any Received from Servers flow.
- A Domino server configured as an outgoing SMTP Gateway won't have any Sent to Servers flow.
In addition to providing quantitative information, the server statistics can also be used to corroborate the usage of a Domino server in the infrastructure.
-
Identity

 : Name of the Domino server.
 : Mail Domain of the server.
 : Title of the server.
 : Type of platform running the Domino server.
 : Hostname of the computer.
 : Time Zone of the server.
 : Application of the DST (Day Saving Time).
 : Unique key used to define this Server statistic document in Mail Flow Analyzer product.
 : List of Alerts (based on Statistics) raised during the updates of this document.
 : Creation date of this statistics document.
 : Latest modification database of this statistic document.
 : Period of time covering the statistics of this document.
-
Global Activity
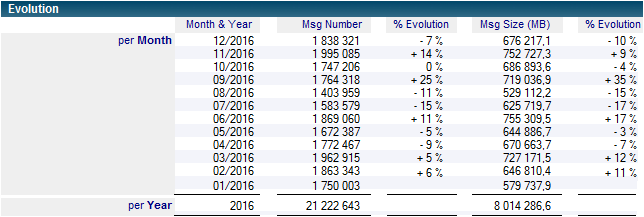
The Global Activity tab combine all numbers of the 4 next tabs (Received from Servers + Local Processes + Local Routing + Sent to Servers) in order to define a coefficient defining the average load of a server. These numbers count twice the number of messages (counted once in the Received from Servers or Local Process and once in Local Routing or Sent To Servers) and should be used only for the comparison of two servers together. The server having the biggest number is the one with the highest load. If the load balancing of users and mail files has been done in a homogeneous way between all the available servers, they should all end up with about the same numbers.

And their evolutions during the previous periods of time:
-
Received from Servers
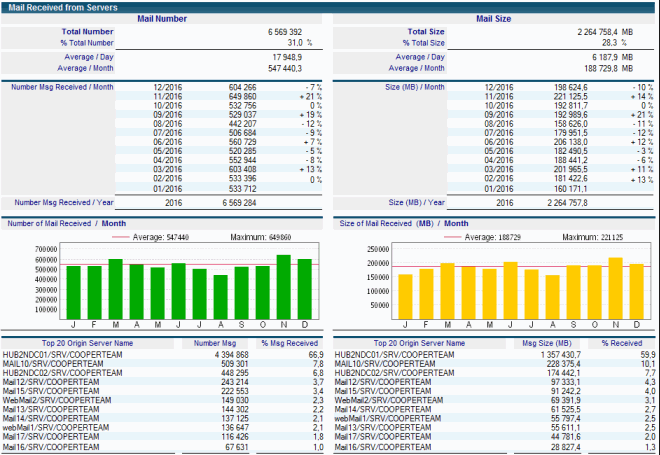
The Received from Servers tab displays statistics about the flow of messages received by the server, coming from other Domino servers of the infrastructure. These messages are dropped in the mail.box database of the server. They are then processed by the router task to be locally delivered (in the mail databases hosted on the server) or sent to other Dominos servers of the infrastructure.

In the lower part of the Main tab, the table Top 20 Origin Server Name displays the names of the servers having sent the messages to the current server (including messages number and messages size statistics):
-
Local Processes
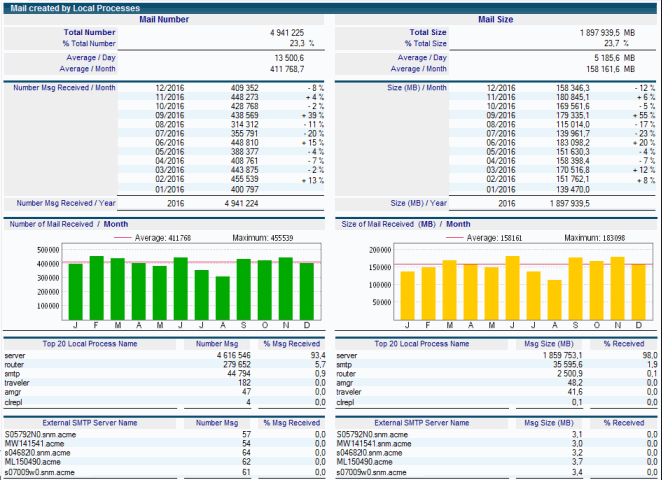
The Local Processes tab displays statistics about the flow of messages created by the Local Tasks of he Domino server, such as :
- server messages sent by users through their Notes clients
- http messages sent by users through iNotes web clients
- traveler messages sent by users through their mobile phones
- smtp messages coming from internet through the SMTP task
- router messages linked to message routing (no delivery failure, return receipt...)
- amgr messages sent by scheduled agents from Notes applications
All these messages are created directly in the mail.box database of the server. They are then processed by the router task to be locally delivered (in the mail files hosted on the current server) or sent to other Domino servers of the infrastructure.

In the lower part of the Main tab, the table Top 20 Local Process Name displays the name of the server tasks having created the messages in the mail.box database (including messages number and messages size statistics). We also find the table External SMTP Server Name showing SMTP traffic coming from mail servers located outside of the infrastructure, declared in the Setup document of the Mail Flow database.
-
Local Routing
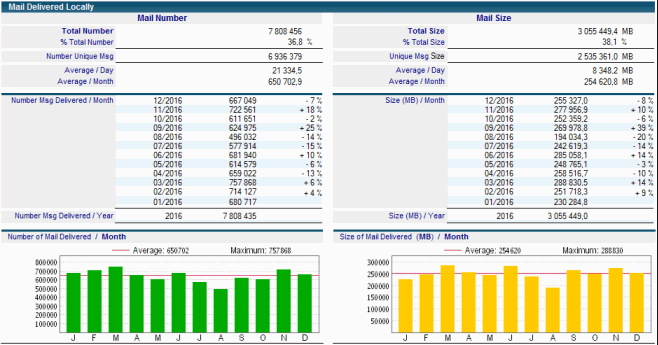
The Local Routing tab displays statistics about all messages delivered in the mail files hosted on this server.

Unlike all the other tabs, for all statistics numbers found in this tab, we do not count unique messages but we consider the total number of recipients having their mail file on this server. We find back our unique messages statistics on the Number Unique Msg line.
-
Sent to Servers
The Sent to Servers tab displays statistics about the flow of messages sent by the server to the other Domino servers of the infrastructure. In order to get valid statistics, you need to install the Mail Flow Analyzer data collector on every Domino server receiving messages from this server (the easy way is to install the mail data collector on every mail server.

In the lower part of the Main tab, the table Top 20 Destination Server Name displays the names of the Top 20 servers receiving messages from this server, including messages number and messages size statistics :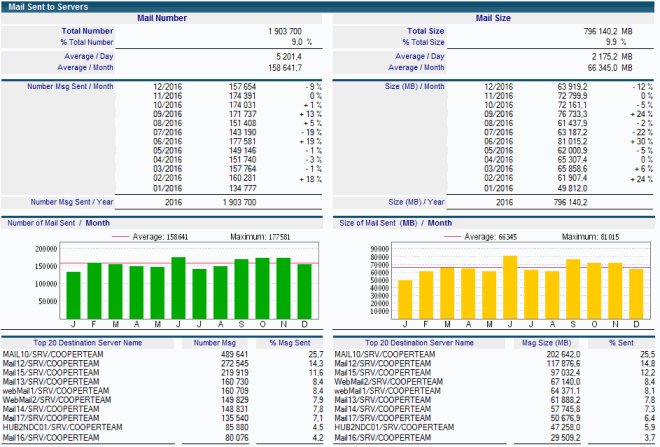
Cross-Server Statistics
The Cross-Server statistics documents are built with 8 main tabs, which are the ones defining the core statistics.

-
Identity

 : Name of the Cross-Server, based of the names of the source server and the name of the destination server.
 : Source server name.
 : Mail Domain of the source server.
 : Time Zone of the source server.
 : Application of the DST (Day Saving Time) on source server.
 : Destination server name.
 : Mail domain of the destination server.
 : Time Zone of the destination server.
 : Application of the DST (Day Saving Time) on destination server.
 : Unique key used to define this Cross-Server statistics document in Mail Flow Analyzer product.
 : List of Alerts (bases on Statistics) raised during the updates of this statistics document.
 : Creation date of this statistics document.
 : Latest revision date of this statistics document.
 : Period of time covering the statistics of this document.
Population Statistics

-
Identity

 : Name of the Population.
 : Number of users and Mail-in databases members of this population.
 : Member list of the Population, as they are defined in the Setup document of the Mail Flow database.
 : Unique key used to define this Population statistics document in Mail Flow Analyzer product.
 : List of Alerts (based on Statistics) raised during the updates of this statistics document.
 : Creation date of this statistics document.
 : Latest revision date of this statistics document.
 : Period of time covering the statistics of this document.
-
Global Traffic
The Global Traffic tab displays statistics about all messages sent or received by the users and the Mail-in databases members of this Population.

-
Sent
The Sent tab displays statistics about all messages sent by the users and the Mail-in databases members of this Population.

-
Received
The Received tab displays statistics about all messages received by the users and the Mail-in databases members of this Population.

-
Sent to Internet
The Sent to Internet tabs displays statistics about all messages sent, by the users and the Mail-in databases members of this Population, to Internet recipients.

-
Received from Internet
The Received from Internet tab displays statistics about all messages received by the users and the Mail-in databases members of this Population, coming from internet.

Cross-Population Statistics
The Cross-Population statistics documents are built with 9 main tabs, which are the ones defining the core statistics.

-
Identity

 : Name of the CrossPopulation, based on source population name and destination population name.
 : Name of the source Population.
 : Number of Users and Mail-in databases members of the source population.
 : Members list of the source Population, as they are defined in the Setup document of the Mail Flow database.
 : Name of the destination Population.
 : Number of Users and Mail-in databases members of the destination population.
 : Members list of the destination Population, as they are defined in the Setup document of the Mail Flow database.
 : Unique key used to define this Cross-Population statistics document in Mail Flow Analyzer product.
 : List of Alerts (based on Statistics) raised during the updates of this statistics document.
 : Creation date of this statistics document.
 : Latest revision date of this statistics document.
 : Period of time covering the statistics of this document.
5. Mail Flow Stat database |
|
|
The Mail Flow Stat database contains the same statistics documents than the databases Mail Flow Server and Mail Flow User together :
 |
= |
 |
+ |
 |
We find in the left navigator all the statistics views available in the two original databases:
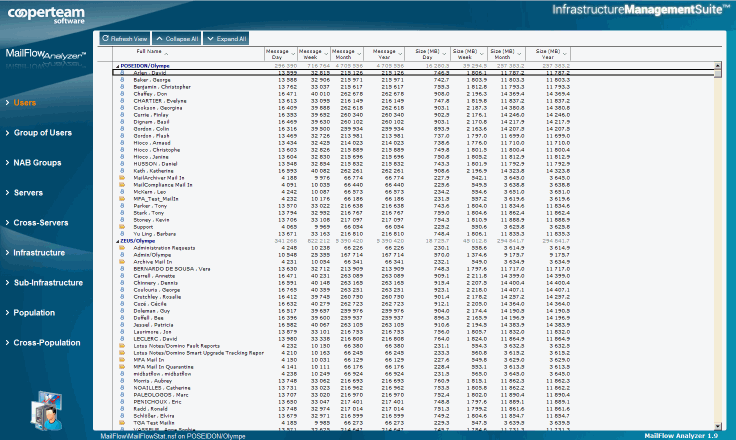
The difference between Mail Flow Stat database and the Mail Flow Server and Mail Flow User databases comes from the access mode. You can access the Mail Flow Stat database using either a Notes client or a Web Browser:
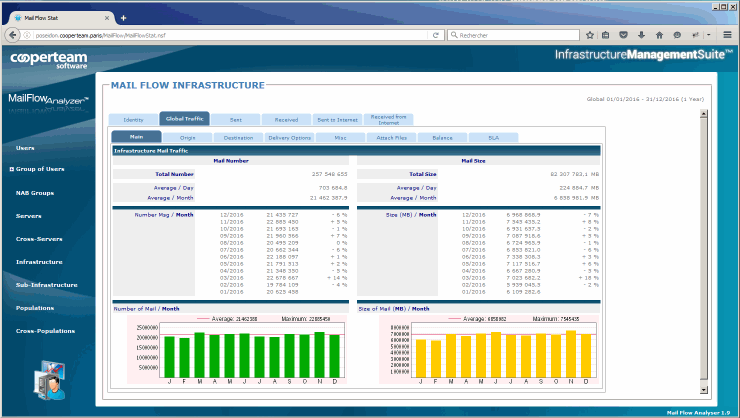
This lightweight access mode let you delegate the access to the statistics documents to people without a Notes Client or for people not allowed to access the Mail Flow Server or Mail Flow User databases. The Mail Flow Stat database may be installed on a Domino server which is not the one hosting the Mail Flow engine.
The documents in the Mail Flow Stat database are protected by security fields (Reader fields) so we can control who can see what using the roles available in the ACL of the database :
[INFRA] This role gives access to all Infrastructure and Sub-Infrastructure statistics documents
[POPULATION] This role gives access to all Population and Cross-Population statistics documents
[SERVER] This role gives access to all Server statistics documents
[CROSSSERVER] This role gives access to all Cross-Server statistics documents
[USER] This role gives access to all User and NAB Groups statistics documents
[CERTIFICATE] This role gives access to all Group of Users : By Certificate statistics documents
[MAILSERVER] This role gives access to all Group of Users : By Mail Server statistics documents
[ORGANIZATION] This role gives access to all Group of Users : By Organization statistics documents
If a person has no role from the ACL of the Mail Flow Stat database, the only document he can see is its own User document. This is the right access mode for sharing with users their own statistics.
Because the primary goal of the Mail Flow Stat database is to give access to the Mail Flow statistics, it is possible to filter what is going to be published. You can decide not to publish some types of statistics documents and also to filter some the statistics number available in the statistics documents. To enable this filtering, we configure what can be published from the Statistics / Publication tab located in the Setup document of the Mail Flow database:
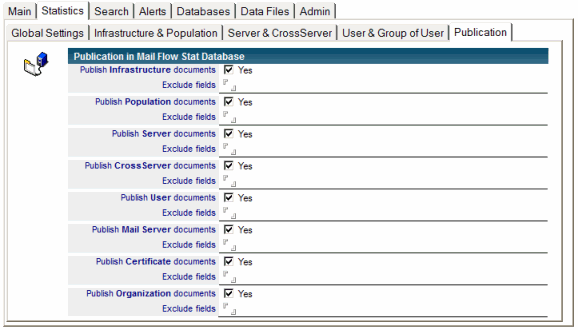
We can select there the types of statistics documents (Infrastructure, Population, Server...) to be published and for each of them, we can provide a list of fields to exclude from the publishing.
6. Mail Flow Dashboard database |
|
|
Overview
The Mail Flow Dashboard database shows key figures of the messaging infrastructure, rendered as dynamic graphic components (pie charts, gauges, bar charts, tables). The database can only be accessed using a web browser and must be installed on a Domino server running the HTTP task. The configuration and the adminiustration of the database is done using a Notes client.

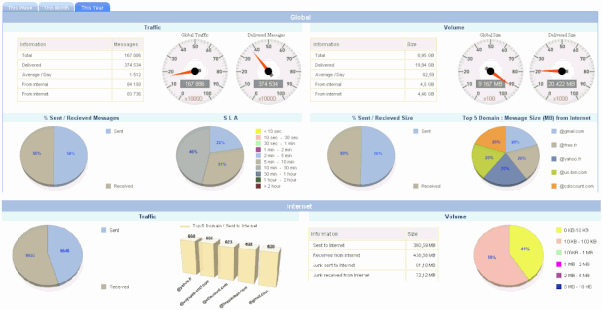
The data displayed on the web page are updated in real time and cover 3 periods of time (current week, current month and current year). They come from the Mail Flow Server database (from Infrastructure documents) through a scheduled agent available in the Mail Flow Dashboard database.
Configuration of the database
The Setup document contains the following fields :

 : Name of the Setup document of the Mail Flow Dashboard database.

 : Path of the Mail Flow database on its server.
 : Name of the Domino server hosting the Mail Flow database.
 : Name of the Setup document of the Mail Flow database.

 : URL of the Domino server hosting the Mail Flow Dashboard database.
 : Supported languages in the Dashboard database.
 : List of CSS files used to render the data on the web page.
 : Play an animation on screen during the loading of the Dashboard web page.
The only fields that need to be checked are the ones linked to Mail Flow location (path of the database, name of the server, name of Setup document) and the URL to access the Domino server hosting the Mail Flow Dashboard database.
In order to validate the link between the Mail Flow Dashboard database and the Mail Flow Server database (through the Mail Flow database), it is needed to force a synchronization between the data coming from the Infrastructure documents located in the Mail Flow Server database and the documents available in the Mail Flow Dashboard database. To perform that, Open the Boards view:
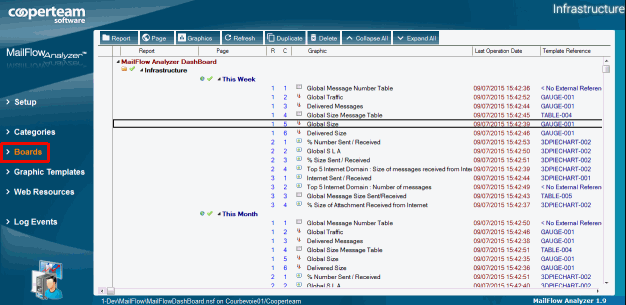
Select a document and use button  /
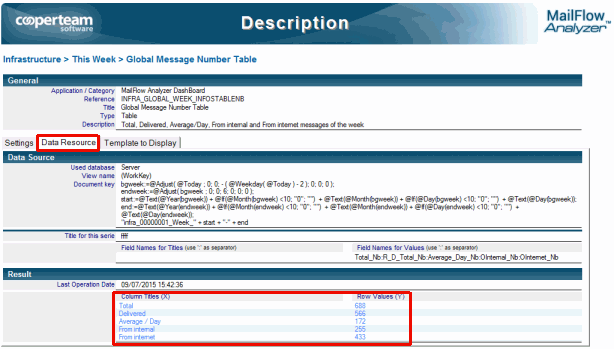
/  . Few seconds later, the latest modification date of the documents will be updated and the fresh data will be stored into Description document, in the Data Resource tab:
To keep the data automatically synchronized, it is mandatory to schedule, every 15 minutes, the pullData agent in the Mail Flow Dashboard database.
Display the Dashboard
From a web browser, you simply have to enter the URL of the server hosting the Mail Flow Dashboard database (par example http://poseidon.cooperteam.com/) and add the relative path to the database (for example MailFlow\MailFlowDashboard.nsf). So you get full URL, looking at this one :
http://poseidon.cooperteam.com/MailFlow/MailFlowDashboard.nsf
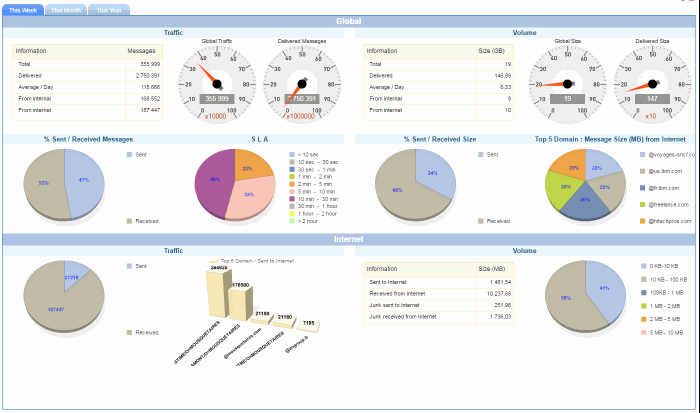
Depending of the configuration of your web browser, you may have to install the Adobe Flash Player extension. After few seconds, the dashboard should be displayed in the windows of the web browser, with the data coming from Infrastructure statistics, for current week period (Week):
You can select the whished period (week, month, year) by clicking the upper left tabs:

You can also activate an periodic change by clicking the icon located at the upper right of the web page.
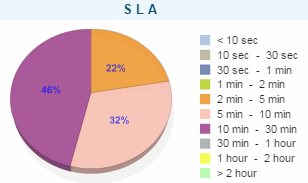
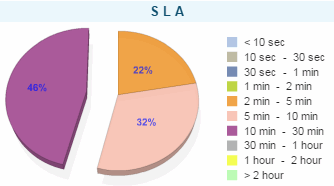
All the graphics on the web page are interactive. You can click on the various elements to animate them. By clicking on the purple part of the pie chart, it comes out :
How to modify the content of the Dashboard
You can modify the types of graphics displayed in the Dashboard web page and even create new pages (to add extra pages to the current existing ones which are the infrastructure week, month and year). For that, you need to create or modify Description documents available from the Boards view. These documents are organized into hierarchy, under the Page document (This Week, This Month...) they are connected:
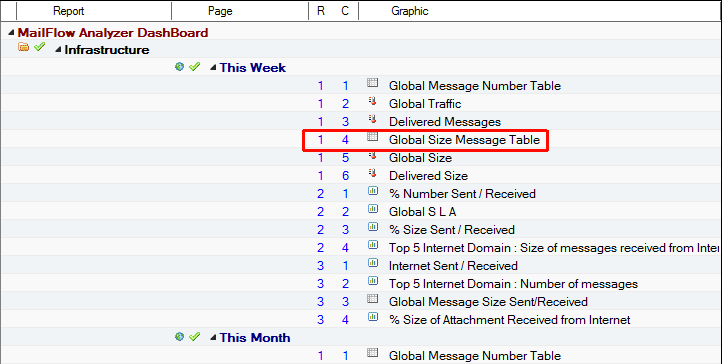
Every Description Notes document represents one of the graphics displayed in the web page. The X-Y coordinates of the graphic are shown in blue in the R C columns of the view. The table Global Size Message Table is located in 1 - 4 in the web page:
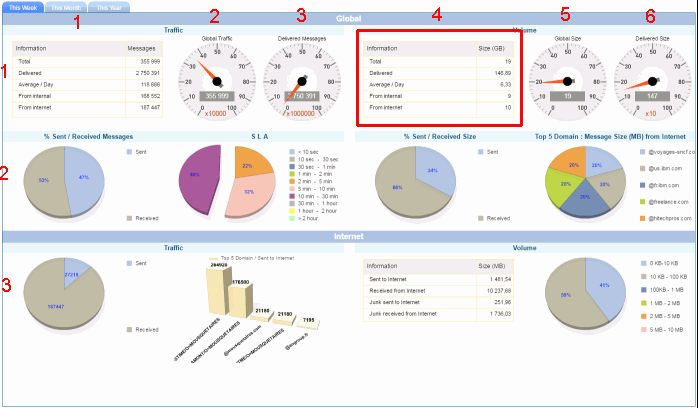
The Description document linked to this table contains 3 main tabs :
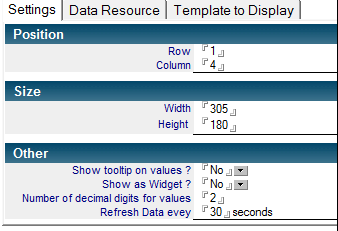
- The Settings tab gathers all display options of this table :
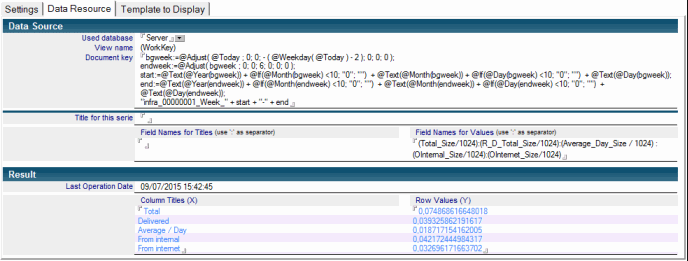
- The Data Resource tabs contains all formula used to compute the data to be displayed :
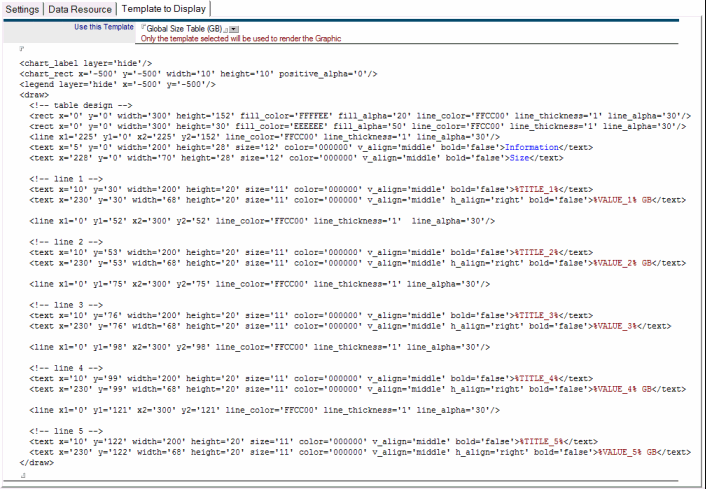
- The Template to Display tab contains information about the type of graphics or the HTLM code of the table :
- Regarding the type of statistics you want to grab from the Mail Flow Server or Mail Flow User databases, you will have to modify Data Source fields from Data Resource tab :

 : Database hosting whished statistics documents (Server or User).
 : Name of the view hosting the whished statistics document.
 : @Formula building the key of the statistics document in the view. We can see that the infrastructure number (00000001) is hard coded. If you want to display statistics coming from a sub infrastructure, you will need to change this number.
In order to test above @Formulas, you have to save and close the Description document, select it from Boards view and click the button  /
/  . The values will be computed by the agent and the data will be available in the Description document, in Data Source tab :
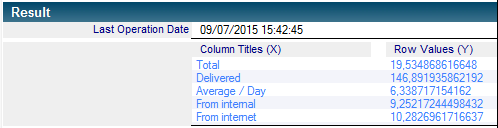
Those values will be displayed in the web page of the Dashboard :
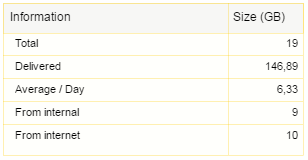
Comments
0 comments
Article is closed for comments.